How can I find the optimal location for my business? What kind of population is near here? Are there any demographic trends I need to plan for? These are just some of the many variables you may need to consider when comparing communities to make business decisions. With ArcGIS Business Analyst, you can map the variables important to you, analyse them across a broad or exact geographic area, share results with stakeholders through maps or reports and help support decision making.
Like all good things, you have a few different Business Analyst flavours to choose from: Pro, Enterprise and Web App. Excitingly, as of the June 2025 ArcGIS Online Update, ArcGIS Business Analyst Web App Standard is available at user types Creator and above. So, I’ll be stepping through the various capabilities of Business Analyst Web App Standard to highlight what’s possible.
As always with GIS, there’s no better place to start than with data.
Data
When we consider the decisions that Business Analyst can help solve, such as which area should we position a new health centre, the data that underpins these decisions must be accurate and up-to-date. Handily, Business Analyst takes care of that. The Data Browser provides users with a curated collection of ready-to-use data with thousands of different data variables for the whole world, including 130 variables for the UK.
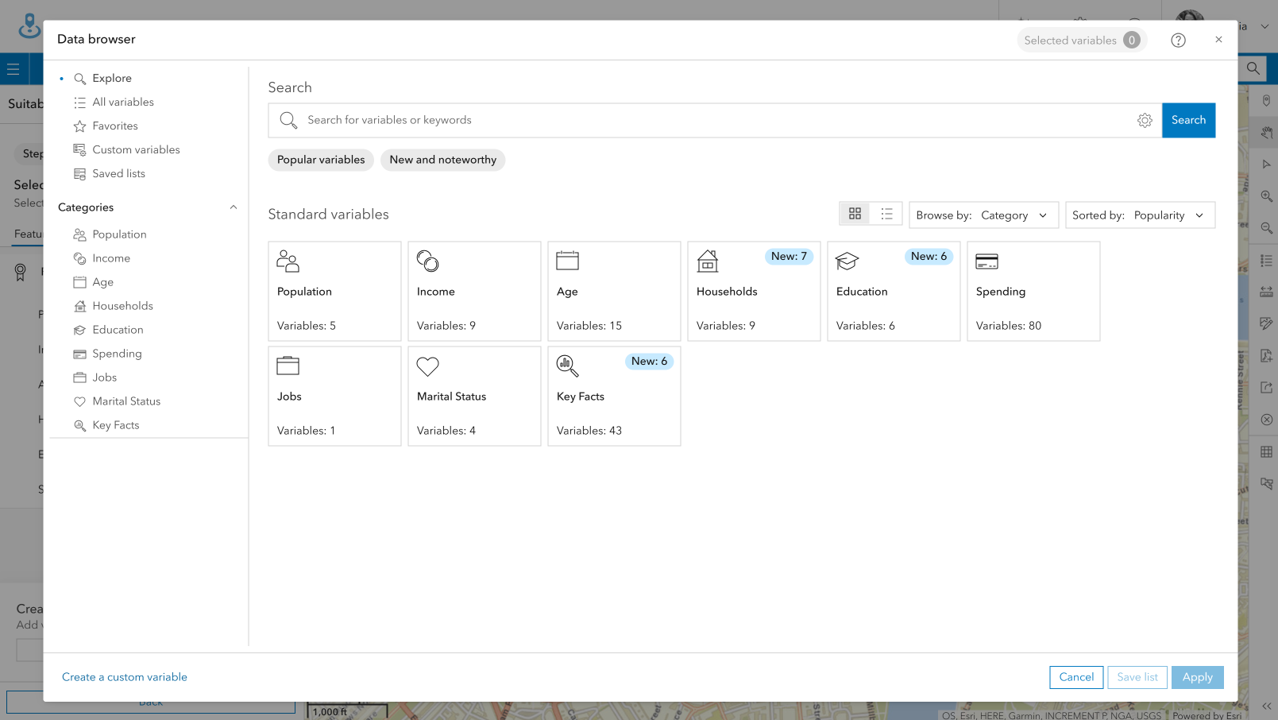
As it’s integrated into Business Analyst, you can quickly add information directly from the Data Browser whenever you’re creating a map, running analytics or generating a report. Similarly, Point of Interest (POI) data from Foursquare is also available in these workflows and offers global data based on 10 major categories including Health and Medicine, Retail, and Travel and Transport.
Maps
We have our data, so now lets have a look at mapping tools that Business Analyst offers. You can quickly and simply map and evaluate a variety of conditions to help make a business decision. There are three focused mapping options to choose from:
Colour-coded maps
In the example beneath, I’ve created a Site (area of interest) around London and used this geography to create a colour-coded map to look at purchasing power for 2024, using data which I found in the Data Browser. I have the option to alter the style, level of detail and legend of my map on the left-hand side.
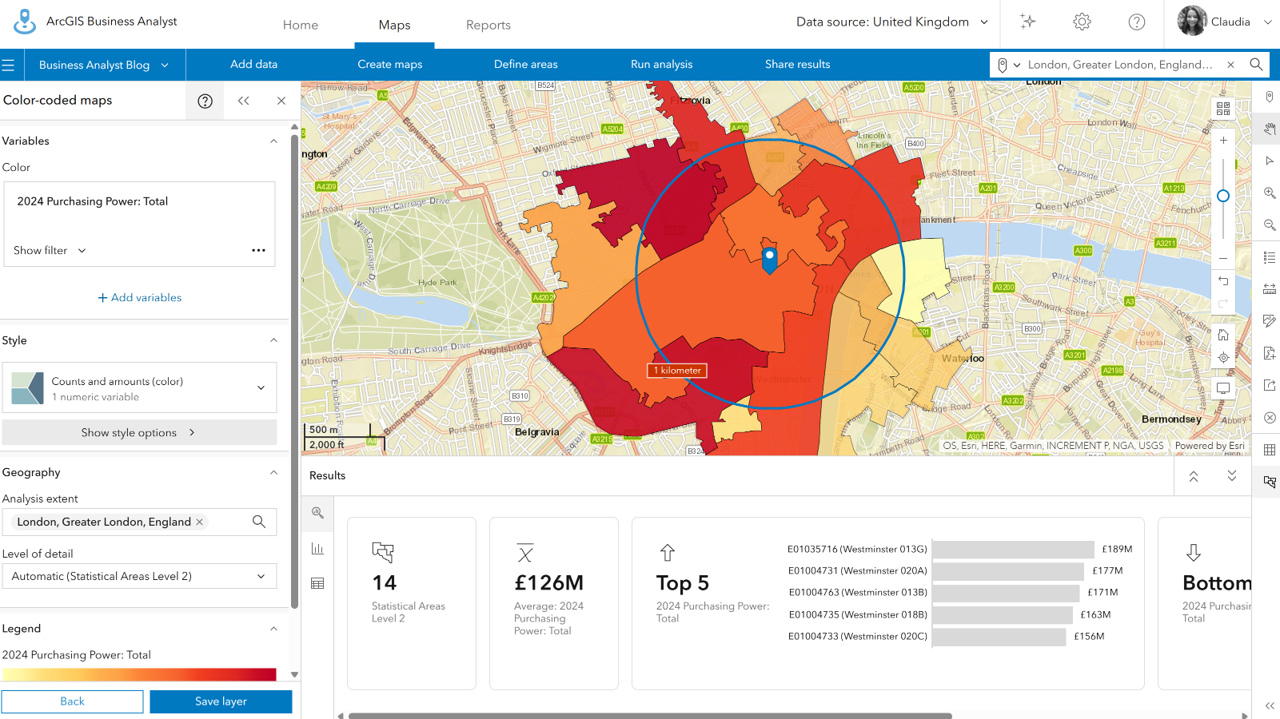
As well as the map itself, you’ll also notice I’m provided with supplementary statistics, graphs and infographics to further understand the results of this tool. This is all automatically generated when running the colour-coded map tool. How easy was that?
Smart map search
This tool allows you to search for locations that meet certain characteristics that you define. Let’s say, for example, I’m considering which areas of Central London would best suit an advertisement for a nearby private school. I can use the smart map search to visualise multiple variables – the ‘2024 Total Population Age 0-14’ and the ‘2024 Purchasing Power: Total’ – shown below. By using the range slider on the left-hand side, I can start to filter down the areas by these two variables and subsequently where the advertisement may be best suited.
Point of interest search
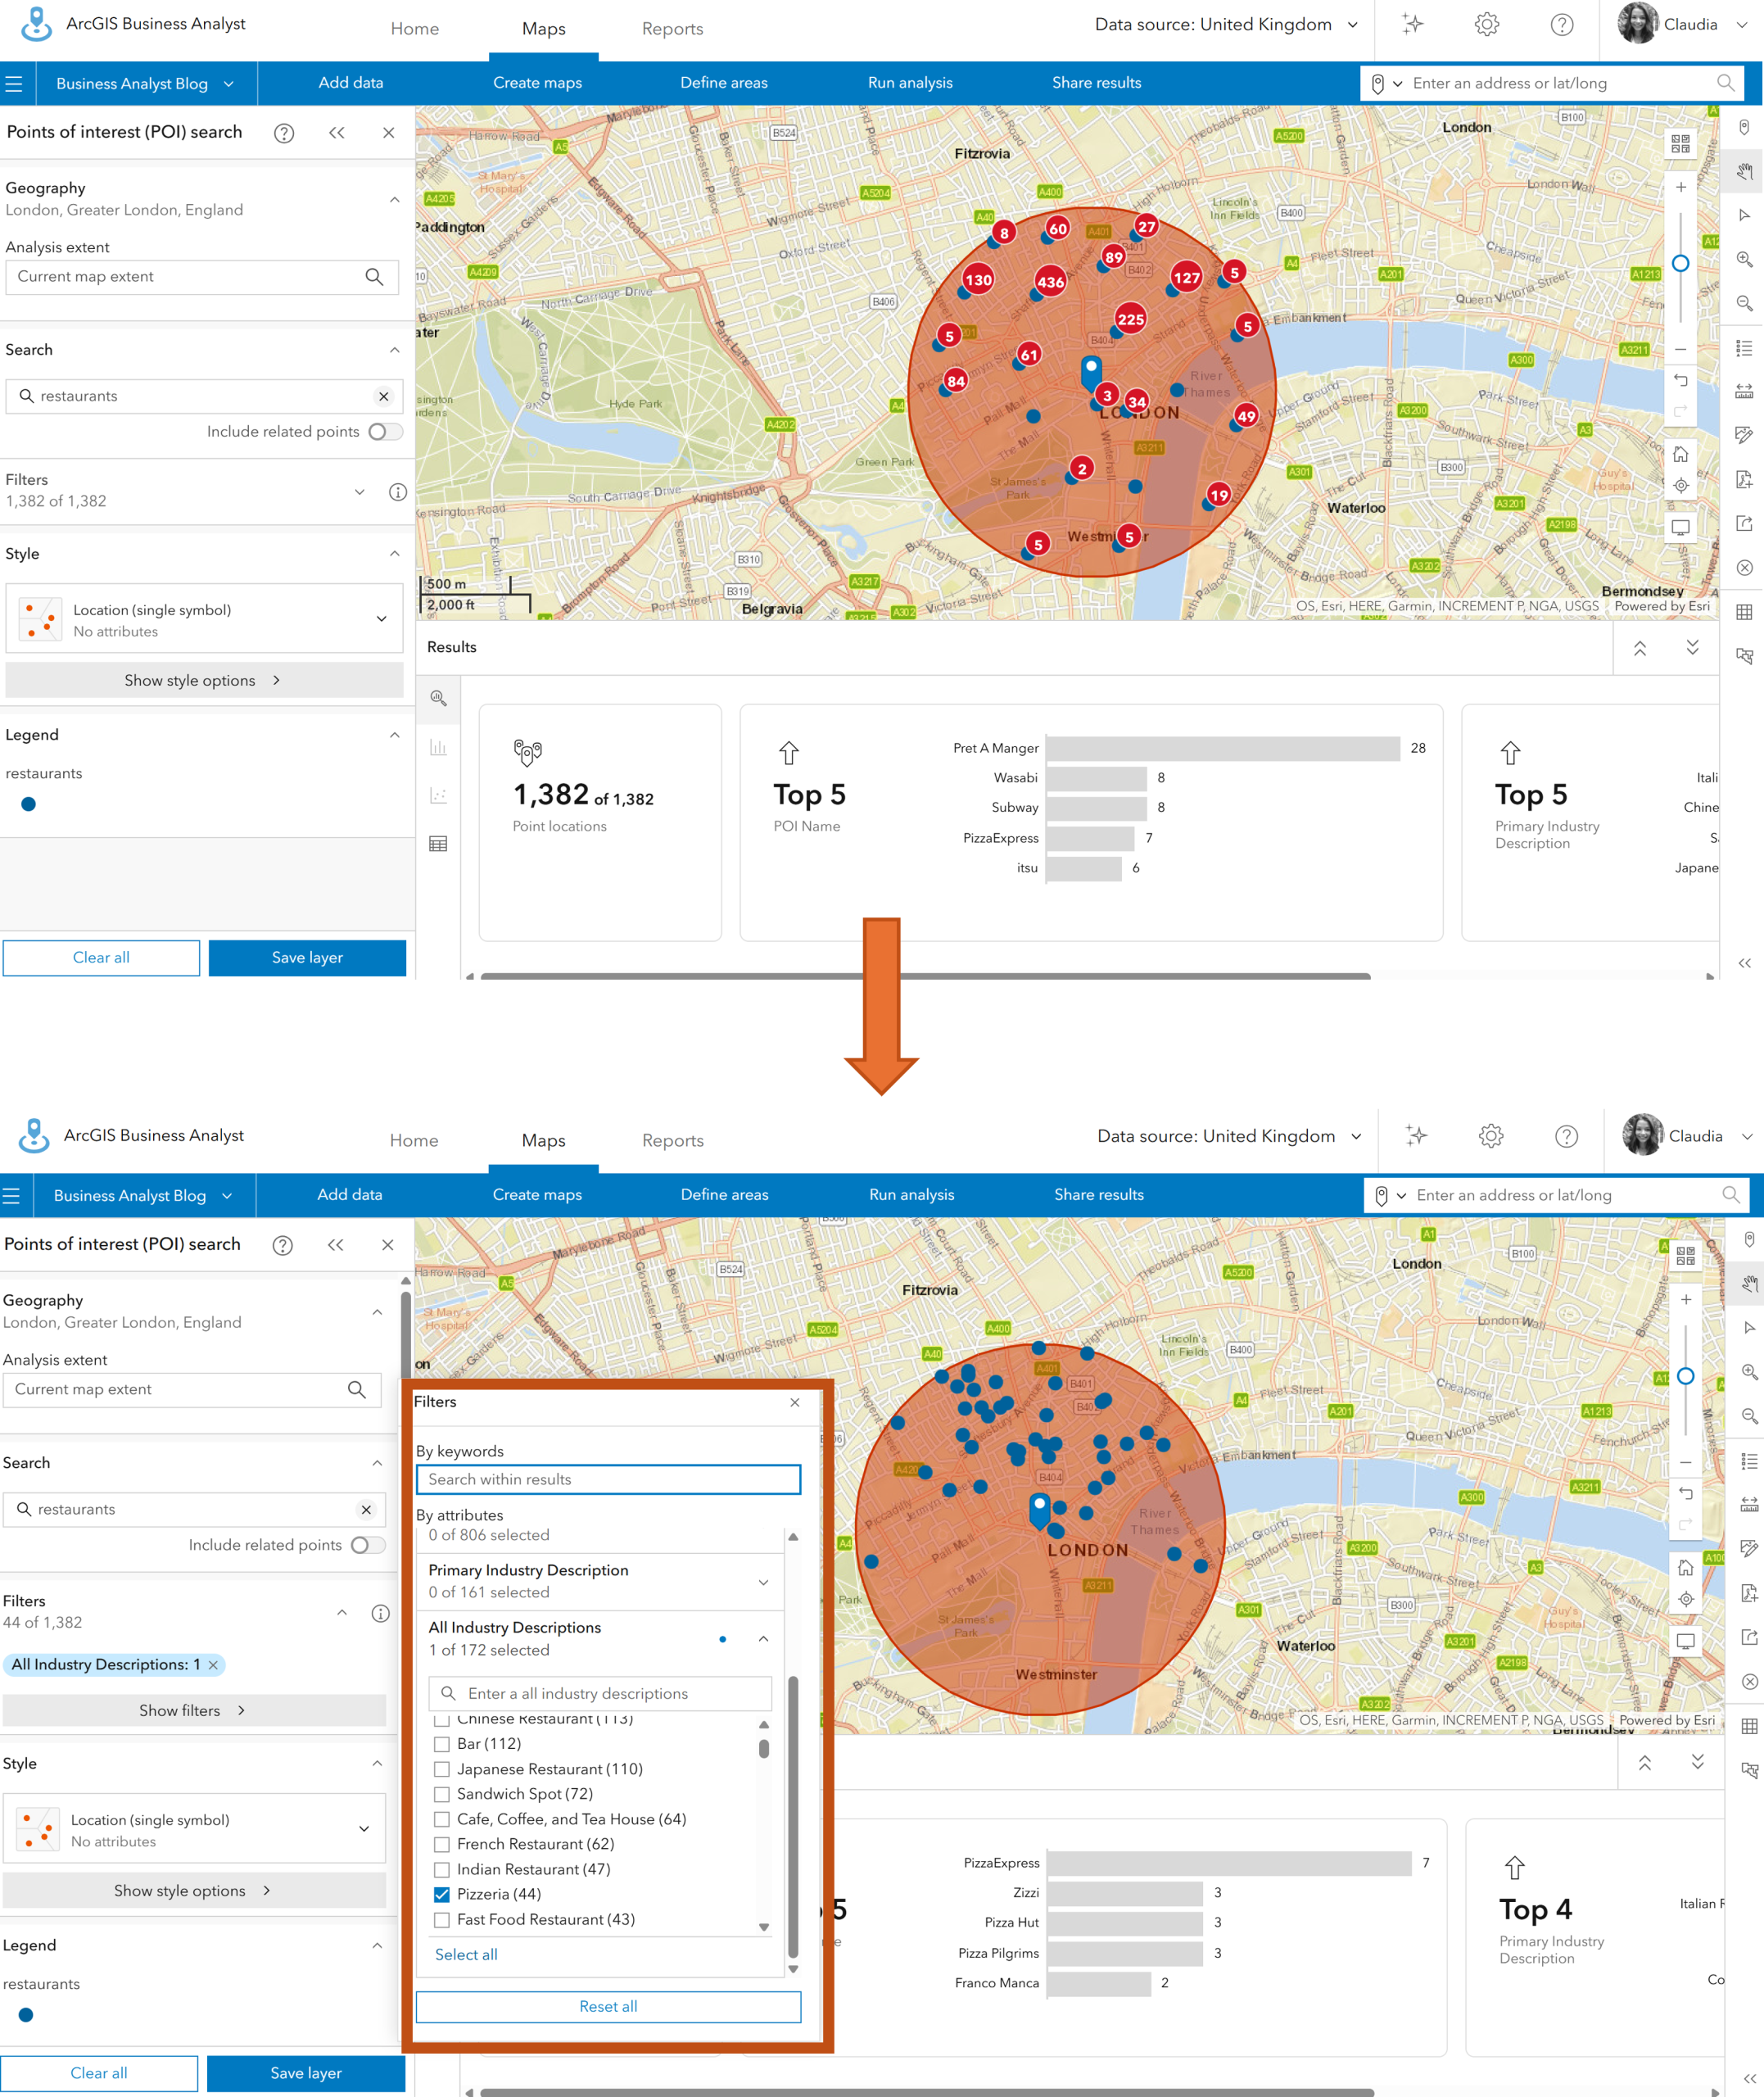
Points of interest (POI) search tool enables you to search for POIs in your map, such as businesses or facilities. You can search for a POI by keyword, by category or by code (supports a number of classification systems). Once you’ve created your list of POIs, you can even save them as a layer for use elsewhere in ArcGIS Online!
Let’s take another example. This time I’m looking to open a Pizzeria and am interested to know where competitors are. Let’s do a POI search for restaurants, again in my configured site of Central London. Typing ‘Restaurants’ as a keyword, we’re returned over 1,382 results and they are instantly added to my map as clustered points. But let’s get a more detailed look at pizzerias specifically – using Filter, then by Industry Descriptions, and then click Pizzeria. Now I get a far clearer picture of where direct competitors are situated and potential gaps for a new location.
These different mapping tools all help to find areas that meet your weighted criteria, locate opportunities and understand communities and competitors – all with a few simple steps and without ever leaving Business Analyst.
Analytical workflows
Business Analyst doesn’t just do maps, it can also be used in analytical workflows that combine your data, maps and location analytics to help identify optimal markets, sites, customers and more. Most analytical tools are only available in Business Analyst Advanced, but the Benchmark Analysis tool is included at the Standard level. To see what capabilities are available at Standard and Advanced license levels, see this documentation.
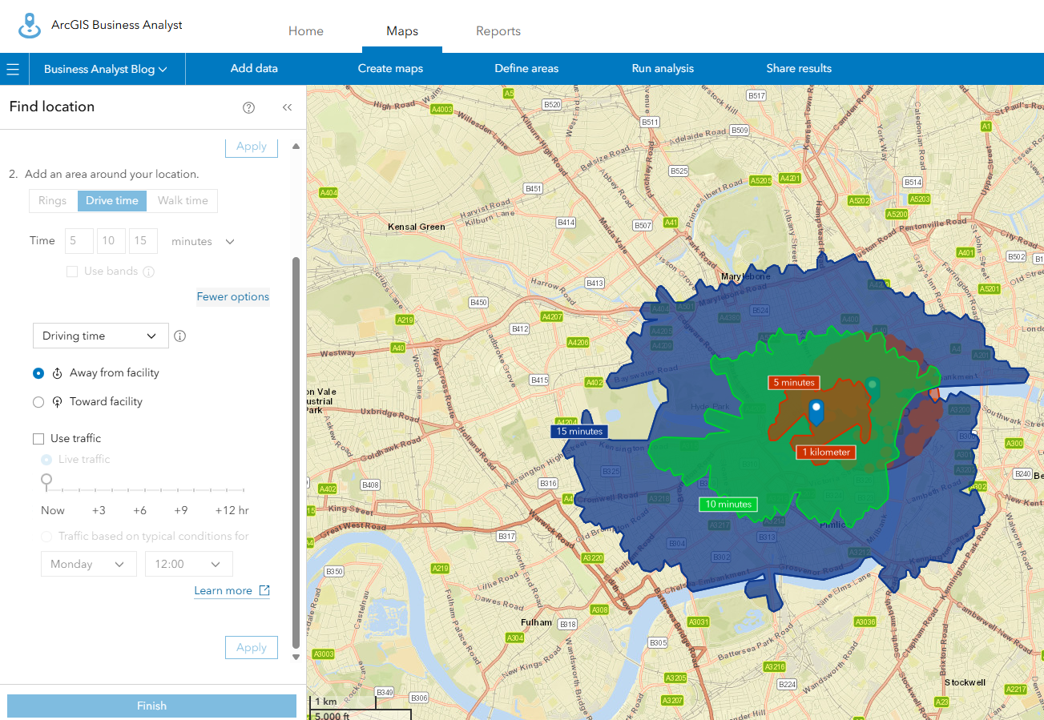
Business Analyst Standard also includes other capabilities, such as creating drive time areas and calculating travel time.
So far, this blog has stepped through the tools available in Business Analyst for visualising, understanding and evaluating your data to help make business decisions. Sometimes, you may want to share these findings with other stakeholders.
Reports and infographics
Readily available in Business Analyst, report and infographic templates can be used to showcase your business findings and engage with others with user type Viewer and above.
Reports
Business Analyst offers five different readily available report templates for the UK – including topics such as demographic, business and market analysis. You can also choose the format of your report, whether that’s PDF, Excel or both.

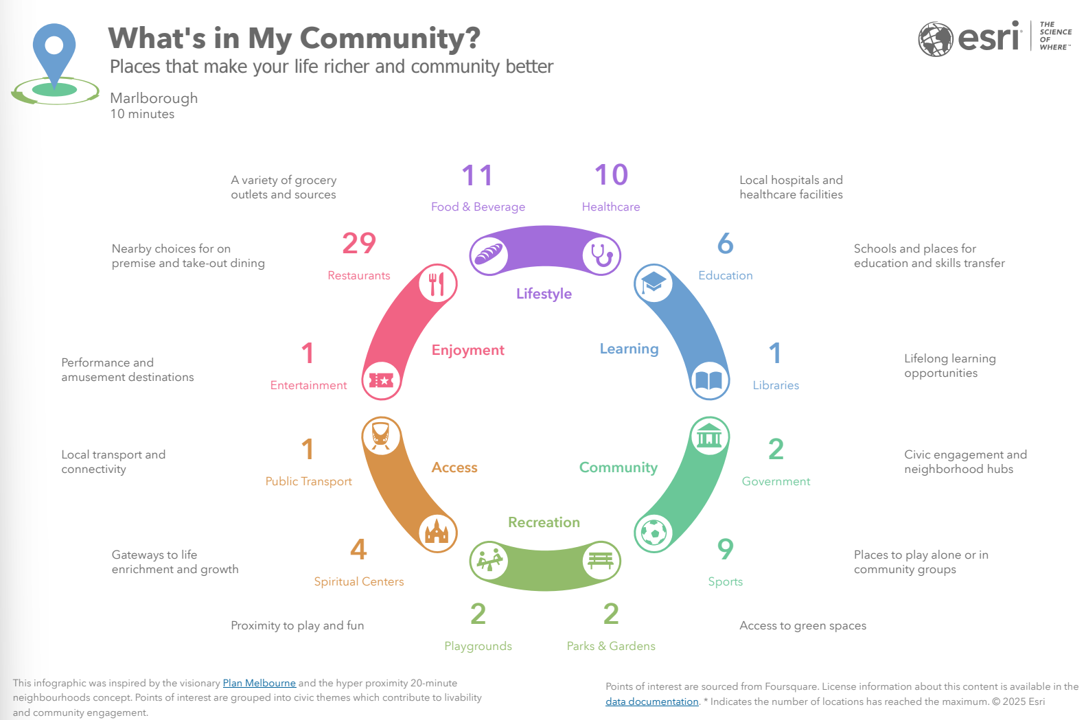
Infographics
An infographic lets users present key indicators or summarise key information through interactive charts, tables, maps and images. There are 11 standard infographics including Key Facts and Demographics, Community Summary, and Nearby Restaurants.
Last few things
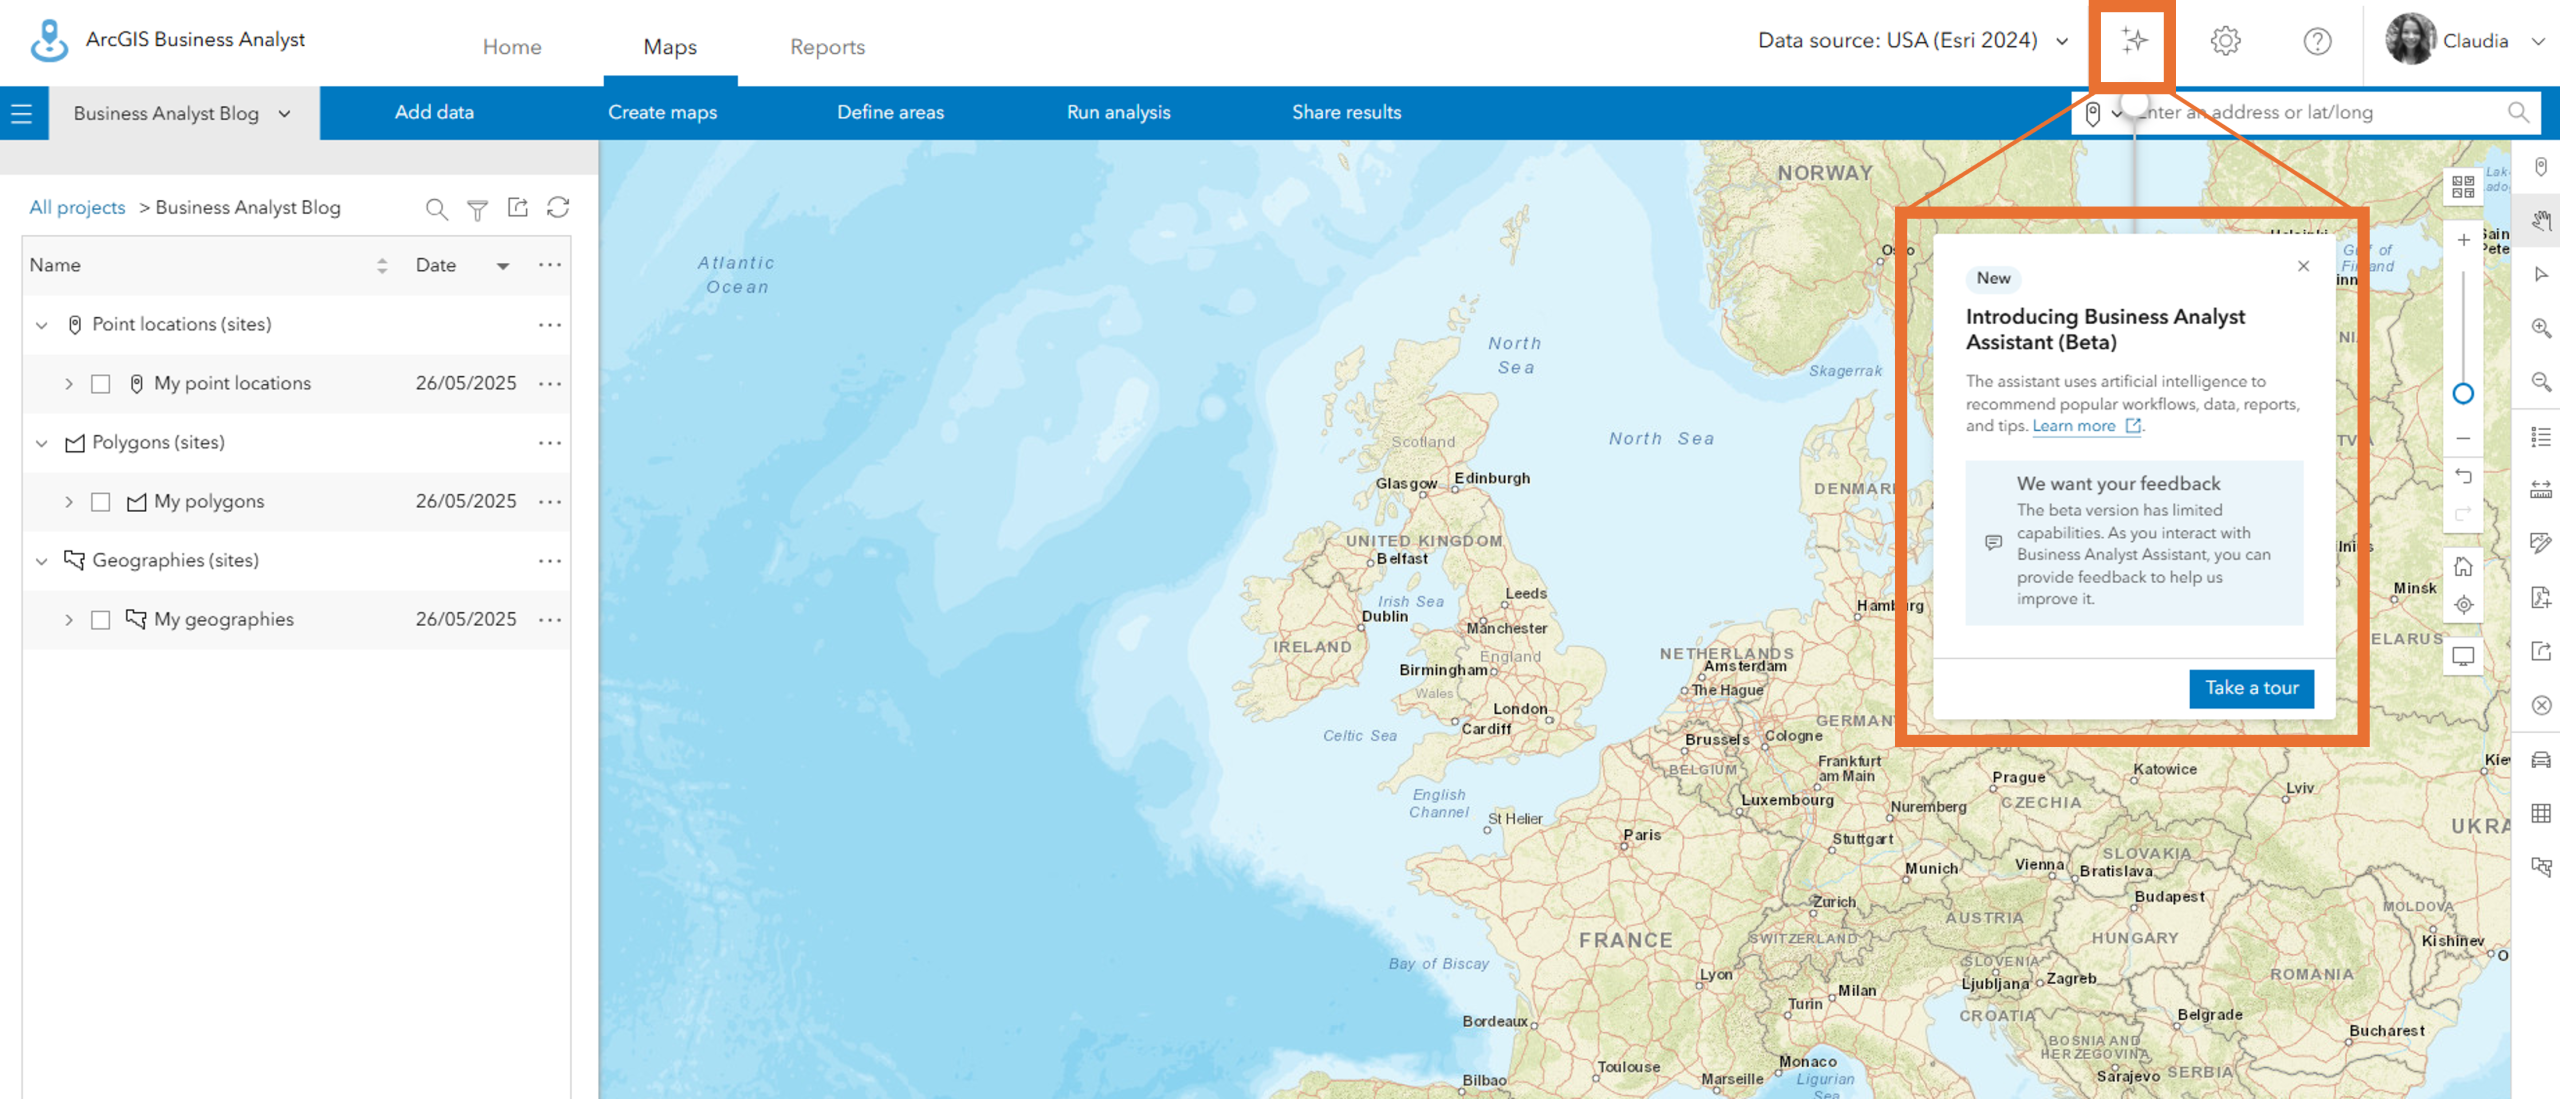
Before you hurry off to try Business Analyst for yourself, please be aware that most actions do consume credits and I recommend that you read the credit documentation first. Whether you’re just starting out or want to explore way’s to streamline your Business Analyst workflows, you could try using the Business Analyst Assistant (Beta). You can find it on the top tool bar, as highlighted in the image below, or learn more here. Also helping you get started, when you open Business Analyst for the first time it offers a tour of the interface and tutorial videos of each tool.
With all these capabilities in the one app, ArcGIS Business Analyst is a really comprehensive tool for demographic mapping and analysis that support complex business decisions. I’ve mentioned some example workflows already, but the use cases for Business Analyst are wide ranging. Other example workflows include:
- Understand community needs for housing. As a housing developer, you may need to understand the demand for housing in certain areas and specifically the needs of the demographic that resides in these areas. For example, does the new development site need to cater for young families or older individuals?
- Regional variation in business performance. Using the Benchmark comparison tool, you can compare sites to understand what demographics might be causing a variation in business performance across different regions.
- Understand hospital demand. When deciding where to distribute funding for new midwifery services across multiple hospitals, stakeholders can use the Smart Search Tool to compare multiple variables such as female populations and existing midwifery services to detect where there’s overwhelming demand.
At Creator user type and above, you can access all the capabilities and tools that we’ve stepped through in this blog, not forgetting the huge library of data variables found in the Data Browser. Whichever decision you’re trying to solve, why not have a look and see what ArcGIS Business Analyst can do for you and your business?